


Why We Needed a vSAN Performance Testbed
In early January, I was asked to provide an analysis on Western Digital’s upcoming products for 2017 and how well each of our devices is geared towards VMware’s vSAN. This was a non-trivial task as we have a wide storage device portfolio that’s certified for use with vSAN.
[Tweet “Pushing #vSAN beyond 600k IOPs! Read about the vSAN performance testbed #virtualization”]The question, then, is this: how does Western Digital help ensure that vSAN administrators, as well as VMware vSAN ReadyNode™ design teams, aren’t deploying square pegs for round holes? We decided to standardize and automate performance tests on the smallest set of hardware possible, to allow for easy apples-to-apples comparisons. This enabled us to quickly test and cycle through multiple vSAN disk group configurations. We could then provide comparative data ranging on everything from hard drives to NVMe™ SSDs.
This is an ongoing process; there is never a single release date for an entire product lineup. So, as we awaited samples of each new product, I realized there was no need to let this hardware sit idle; we could use it to perform an in-depth study on vSAN performance tuning and feature performance.
As a virtualization, storage, and infrastructure specialist, this would help me understand the impact of the best practices put forth by VMware, as well as the performance impact of features such as Object Checksum, Deduplication and Compression, Erasure Coding, RAID5/6, and Data-at-Rest Encryption.
Design and Configuration
With these goals in mind, I set out to design “one rig to rule them all”—one optimized cluster to be used for hybrid and all-flash vSANs. My immediate thought was that this wasn’t possible. We have 3.5” and 2.5” form-factor spinning drives and SSDs, not to mention add-in-card NVMe and U.2 NVMe devices. With such a variety, we needed to deploy separate vSAN configurations with the CPU, memory, and networking options being as similar as possible.
Fortunately, I work at Western Digital’s Data Propulsion Labs, where the DPL hosts a wide variety of leading edge server platforms and infrastructure capabilities. I selected the Grantley-EP (Versions 3 and 4 of the Xeon® E5 Series) platform as the common CPU and chipset combination, as well 56Gb Ethernet from Mellanox® to ensure that networking would not be a bottleneck. I also standardized where possible on Broadcom® LSI SAS/SATA controllers to take OEM-specific hardware out of the mix. Here is the generic cluster configuration:
(4) Grantley-EP Dual Socket 1U or 2U Servers each with:
(2) E5-2697 V3 or E5-2697A V4
(8) 32GB DDR4-2133 or DDR4-2400 or 256GB Memory
SD Card or USB boot device
Dual Port Mellanox ConnectX-3 Pro 40Gb/56Gb Ethernet adapter
(2) Broadcom LSI 9300-8I – For SAS and SATA configurations
(2) Disk Groups per Node
–Disk Group Configuration— (Generic All-Flash Configuration)
(1) Caching Tier Device
(2) Capacity Tier Devices
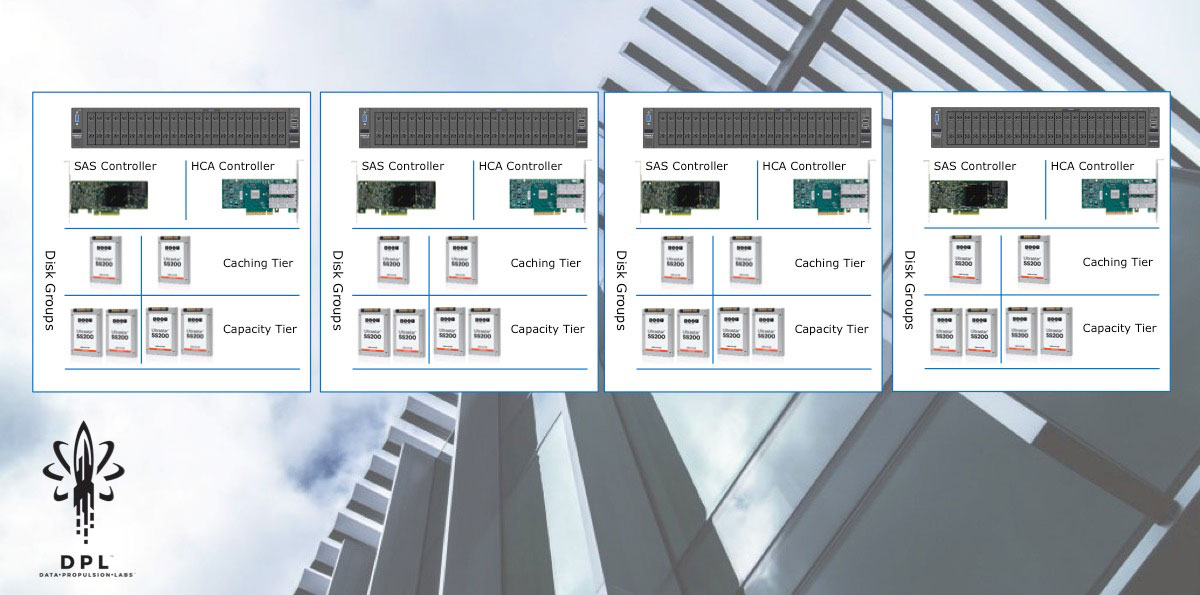
With this basic server specification, I provisioned three separate clusters: one for testing 2.5” SAS and SATA media, one for testing U.2 NVMe devices at scale, and the last for 3.5” SAS and SATA media.
This blog does not offer a full architectural discussion or technical configuration; it focuses on testing methodologies, initial results, and further improved results with VMware’s assistance. I will be authoring additional blogs surrounding architecture and configuration for this scenario, which you can follow on this blog.
Testing Methodology
As I approached testing methodologies I did what most technologist do: I fell back on what I knew and what was easy for me. The Data Propulsion LabsTM’ mandate is to use application knowledge—Oracle®, Microsoft® SQL, Cassandra™, MySQL™, etc.—to benchmark a system from the customer’s perspective. My particular application knowledge surrounds Microsoft SQL, so I’ll be implementing a TPC-C-like workload to understand how each cluster performs in regards to New-Order Operations Per Minute (NOPM).
Like walking before running, it’s best to baseline a storage subsystem to ensure basic performance before moving into application performance. For this I reached out to our colleagues at Storage Review to emulate the testing they did with HCIBench in their vSAN performance reviews. I emulated Storage Review’s testing methodology with the HCIBench benchmark tool and achieved my first baseline results.
Specific Cluster Configuration:
(4) Grantley-EP Dual Socket 2U Servers each with:
(2) E5-2697 V3
(8) 32GB DDR4-2133 256GB Memory
USB boot device
Dual Port Mellanox ConnectX-3 Pro 56Gb Ethernet adapter
(2) Broadcom LSI 9300-8I – For SAS and SATA configurations
(2) Disk Groups per Node
–Disk Group Configuration–
(1) 1.92TB HGST Ultrastar® SS200
(2) 7.68TB HGST Ultrastar SS200
Establishing a Better Performance Baseline
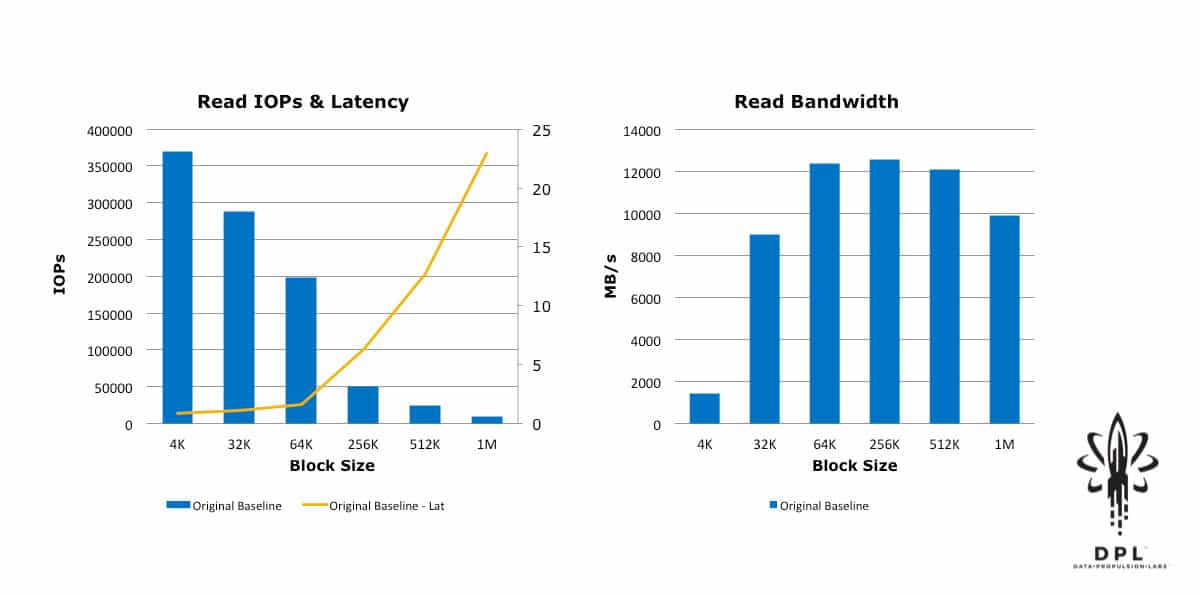
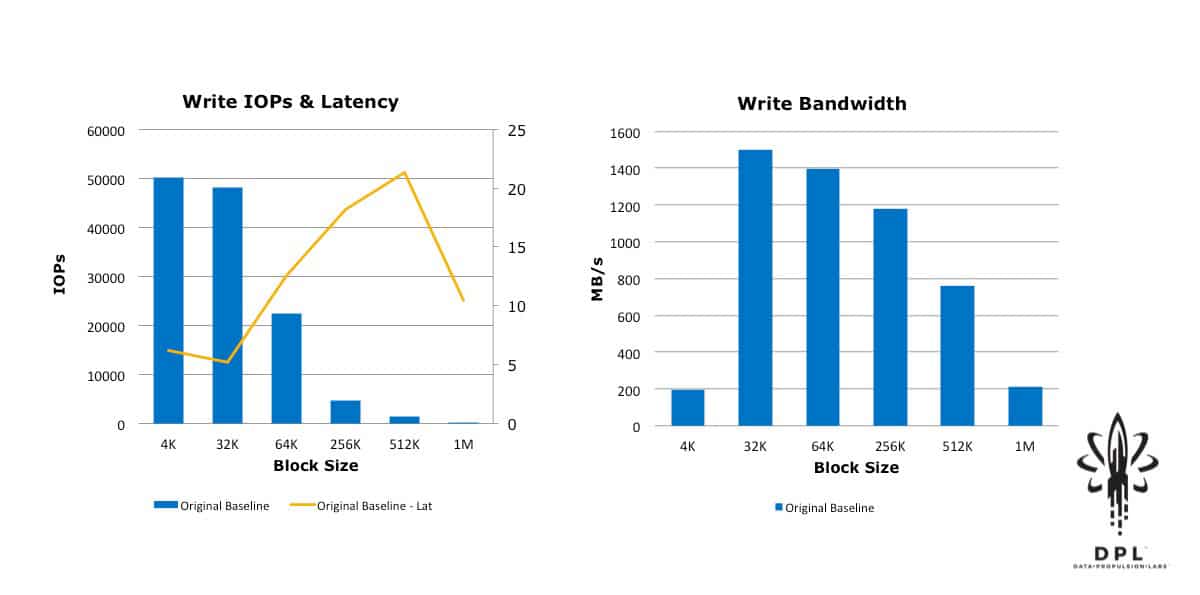
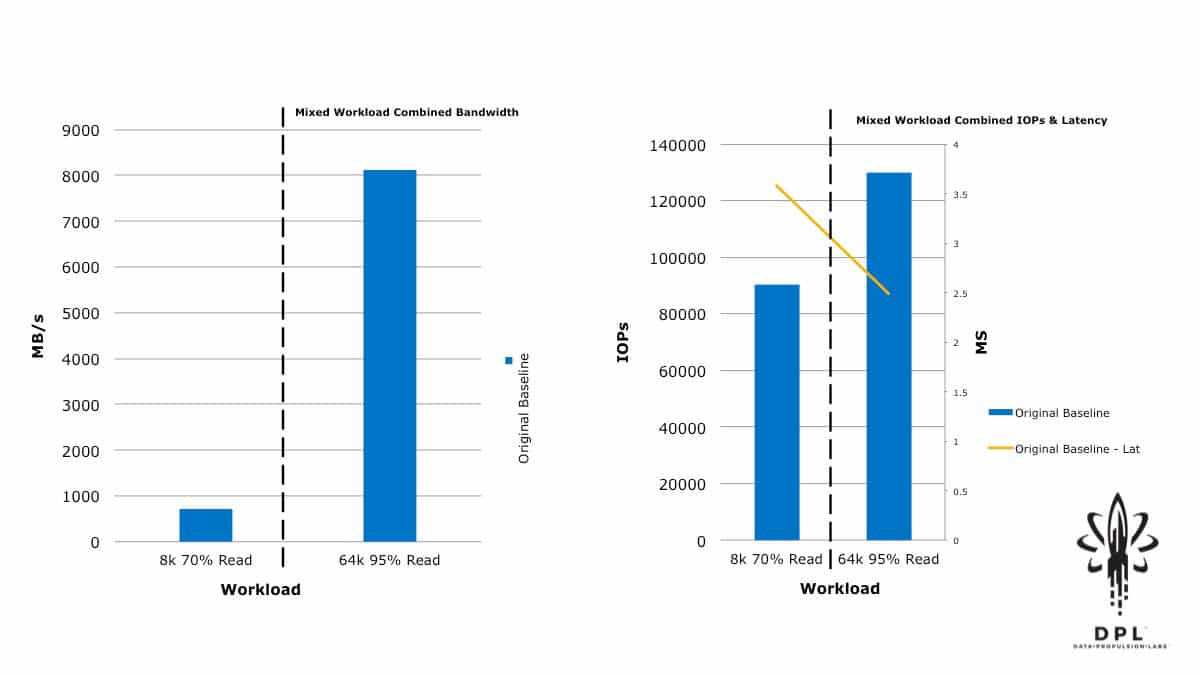
I was pleased that the initial results were quite comparable to those in this Storage Review article. Given the raw capabilities of this product, I also knew that we weren’t coming close to the full performance potential of this implementation
With this in mind, I approached VMware and had some discussions with Chen Wei, the author of HCIBench, as well as some of the vSAN performance engineers. They immediately pointed out that I had neglected to turn off Object Checksum, and they provided restructuring guidance for the HCIBench configuration and workload sizing guidance. Based on that guidance, I then restructured the HCIBench VMs and adjusted the test workloads to align with their rules of thumb for workload block size vs. outstanding I/Os (Total Effective Queue Depth). I ran the tests again, and then for good measure I doubled the block size vs. outstanding IO guidance and ran again; and then quadrupled the guidance and ran yet a third time. The results were quite enlightening.
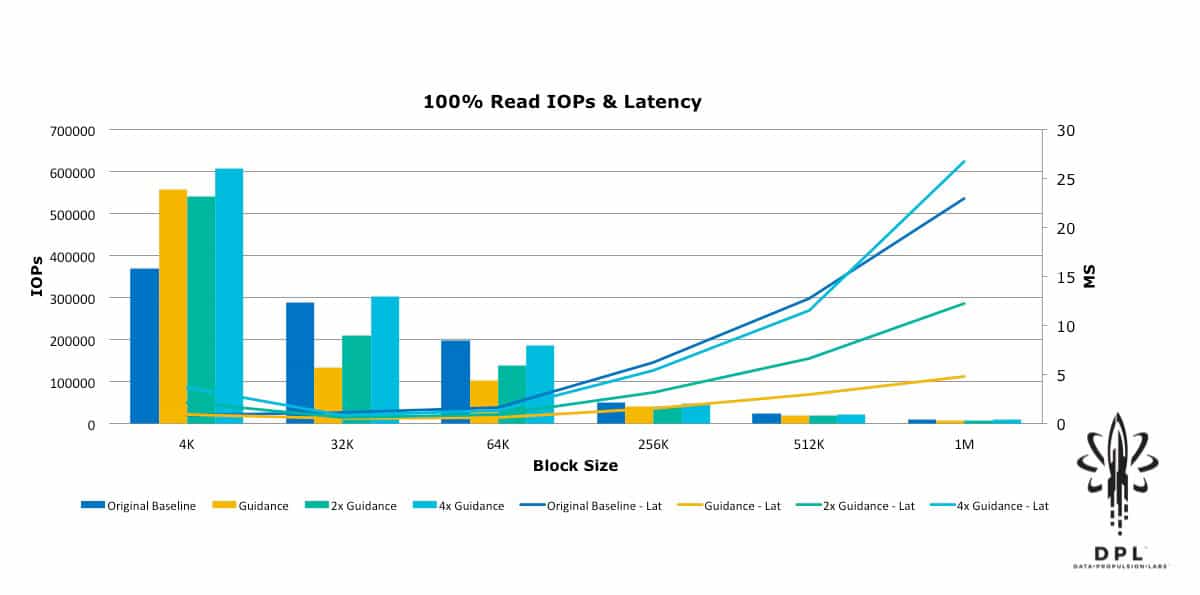
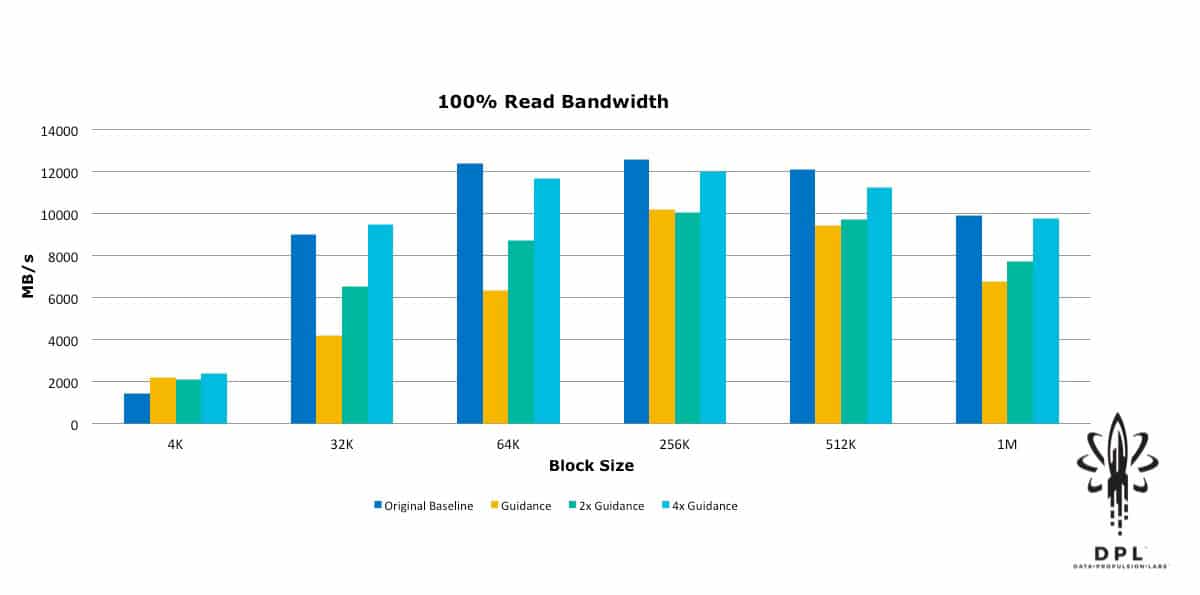
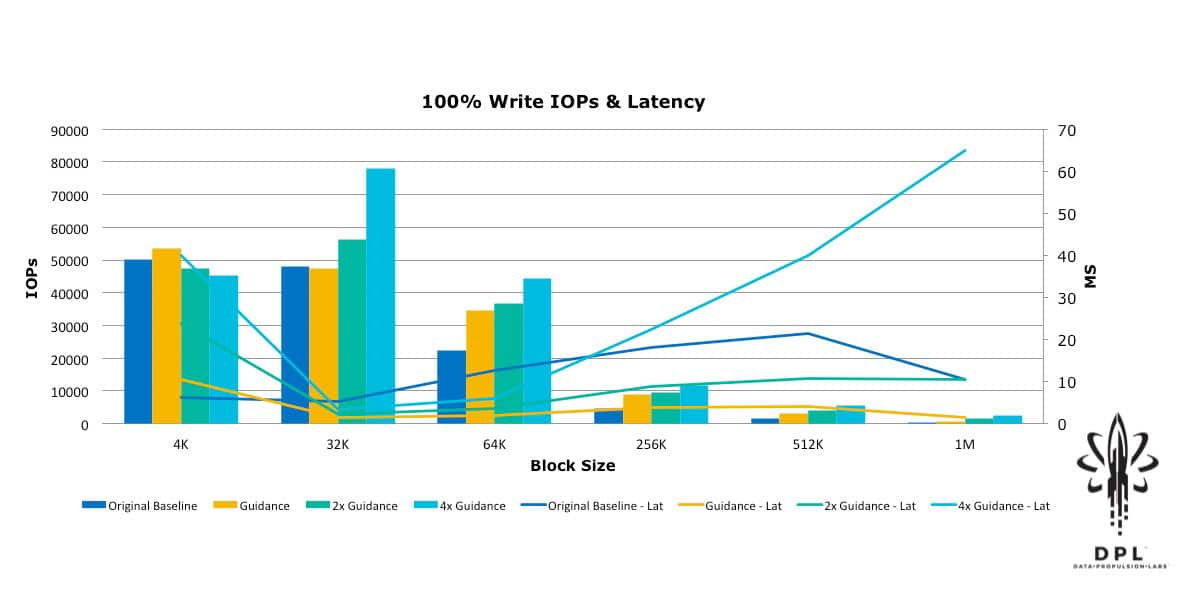
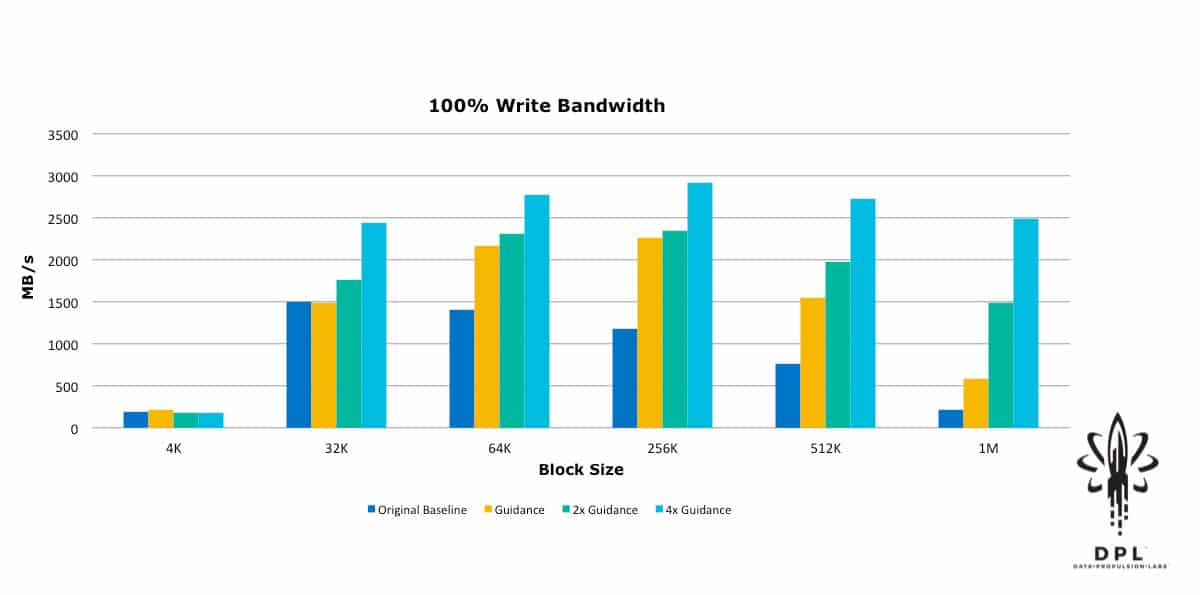
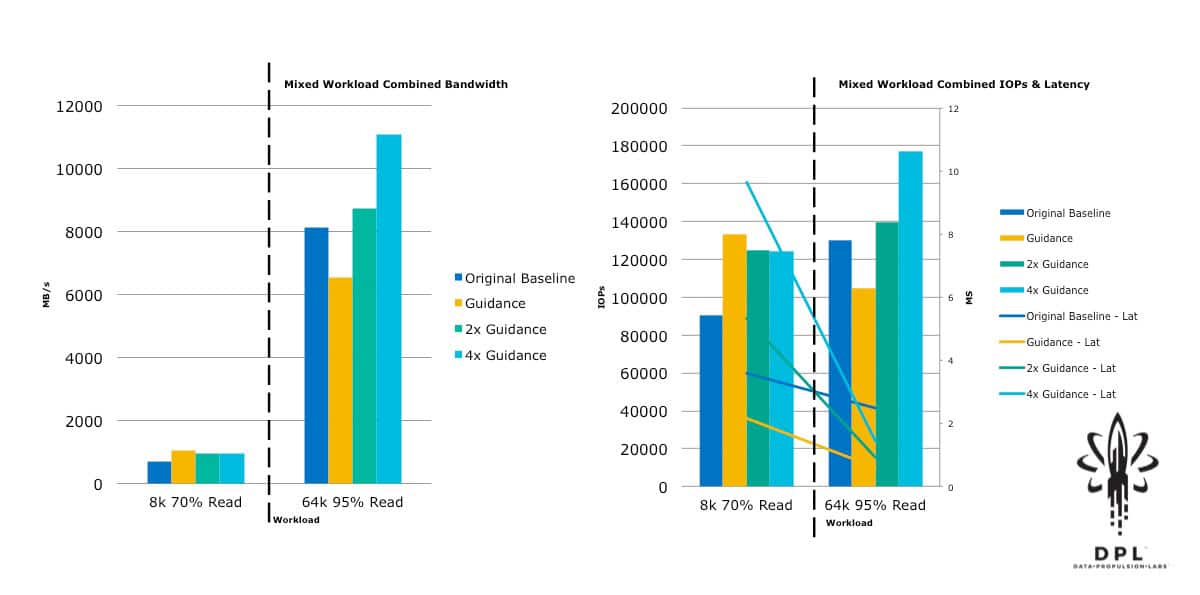
Yes, that is 600,000+ 4k Random Read IOPs! This was a substantial improvement from the original baseline. This new baseline will be used as the reference in future blogs about how to push these numbers further, as well as how performance is affected by features such as Object Checksum, Deduplication and Compression, Erasure Coding RAID5/6, and Data-At-Rest Encryption.
Up Next – Configuration, Features and Performance
I’m excited to share not only the additional results from these clusters but also discoveries I’ve made, the exact design consideration I used, and how I proved the design. See my next blog, next week, to learn more about the vSAN Performance Testbed’s vSphere Post-Install, Network Configuration, and vSAN Cluster Setup.
You can subscribe below to the data center tech blog to receive notifications of new posts directly to your inbox, or subscribe to my blogs via RSS!
Read my next blogs: